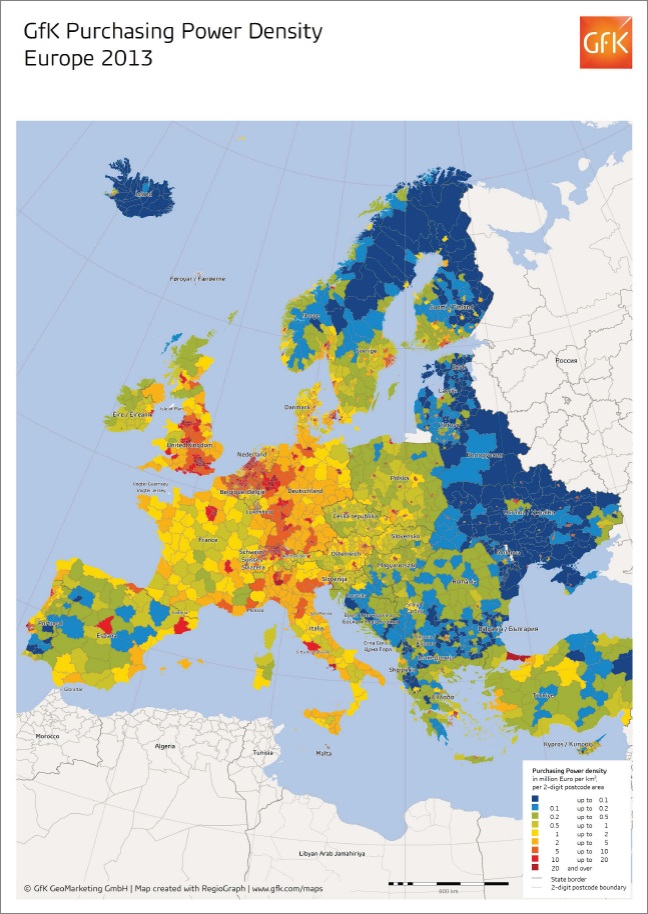
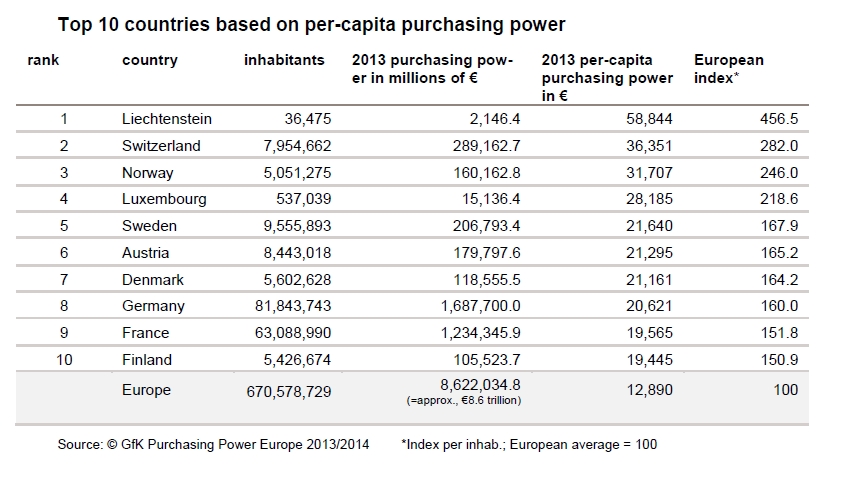
The updated study "GfK Purchasing Power Europe 2013/2014" reveals the regional distribution of consumers' purchasing power in 42 European countries. The spectrum ranges from 4.5 times the European average in Liechtenstein to one-tenth the average in Moldova.
According to the GfK purchasing power study, a total of approximately €8.62 trillion is available to European consumers in 2013 for spending and saving. This corresponds to an average per-capita purchasing power of €12,890 for the 42 countries under review.
Considerable discrepancies remain between the income available to inhab-itants of these 42 countries for consumer spending.
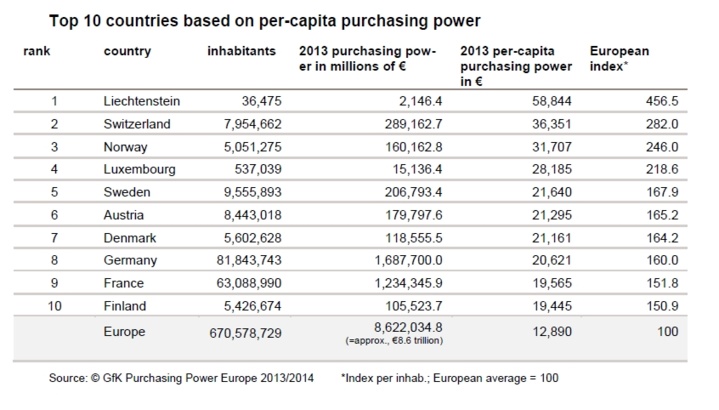
Liechtenstein remains in the top position with a per-capita purchasing pow-er of €58,844. Switzerland takes second place with €36,352, followed by Norway with €31,707 of per-capita purchasing power. Moldova is once again in last place with only around €1,284 per person. This amounts to less than one-tenth of the European average of approximately €12,370 per person; this latter figure roughly corresponds to the purchasing power of Spain.
General purchasing power refers to the money available to consumers for all expenditures related to food, accommodation and services as well as consumer purchases. Inhabitants of the European countries with the high-est purchasing power must devote a large portion of their income to rent and generally more expensive living costs. Even so, inhabitants of these countries have substantially more money for non-essential purchases than consumers in countries with low purchasing power. The Europe-wide per-capita growth (revised) is 0.39 percent, which lies below the inflation rate of 1.5 percent determined by the European Central Bank. The GfK purchasing power study reflects the nominal purchasing power in euros, which pro-vides a unified basis for comparing these values down to the most detailed level, Europe-wide. The exchange rates for non-euro countries are based on Eurostat figures from August 8, 2013.
Regional comparisons within and between countries
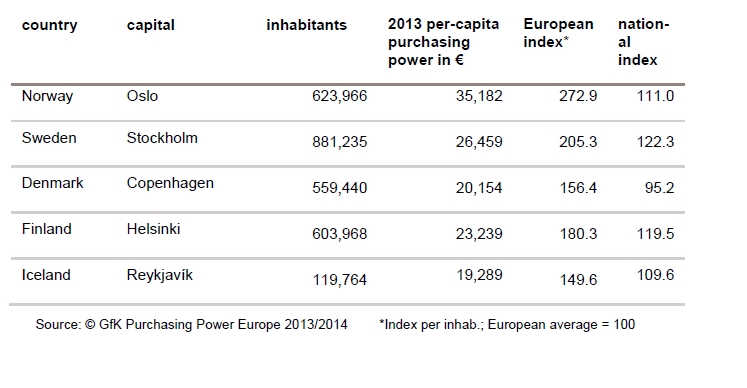
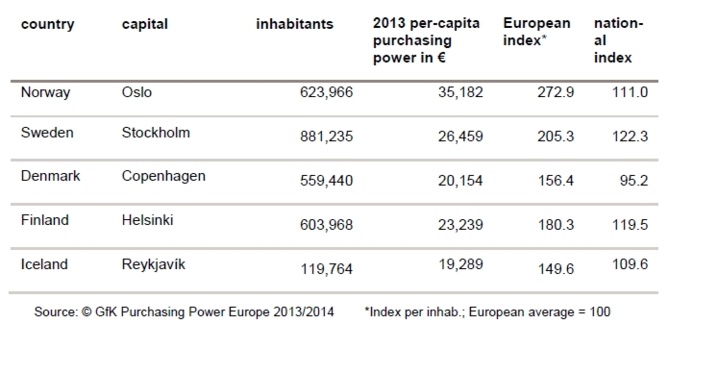
Northern Europe from Norway's perspective Norway ranks third in Europe, and its Nordic neighbors are also strong performers: Sweden ranks fifth, Denmark seventh and Finland 10th. With the exception of Iceland (ranked 13th), all of these countries are among the ten European countries with the most per-capita purchasing power.
Norwegians have an average of approximately €10,000 more at their dis-posal than Swedes, who have €21,640 per person. But Sweden is the vic-tor when it comes to total market volume: The approximately 9.5 million Swedes have a total purchasing power of €206 billion, while the approxi-mately 5 million Norwegians have €160 billion, despite an almost fifty per-cent higher per-capita purchasing power.
Purchasing power differences exist across the regions of these countries, but they are not nearly as pronounced as in the central and eastern Euro-pean countries: At the level of Norway’s 90 "Oekonomiske Regionar", the divide ranges from a national index of 121.3 in Baerum, 111.9 in Stavanger (ranked second) and 111.0 in Oslo (ranked third) to 87.3 in Nord-Gudbrandsdalen. The inhabitants of this least wealthy region in Norway still have an average per-capita purchasing power of €27,676. This is 34 per-cent more than the national average for Germany and approximately the same amount available to inhabitants of the rural district of Ebersberg, which is ranked sixth among Germany's districts. Inhabitants of Reykjavík, the Icelandic district with the most purchasing power, have €19,289 available per person, which is significantly less than the least wealthy Norwe-gians. With €26,459 available per person, inhabitants of Sweden's wealthy capital Stockholm also have less than the “poorest” Norwegians.
Central-Eastern Europe from Poland's perspective
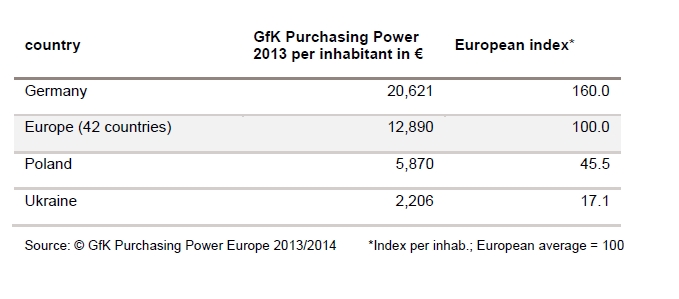
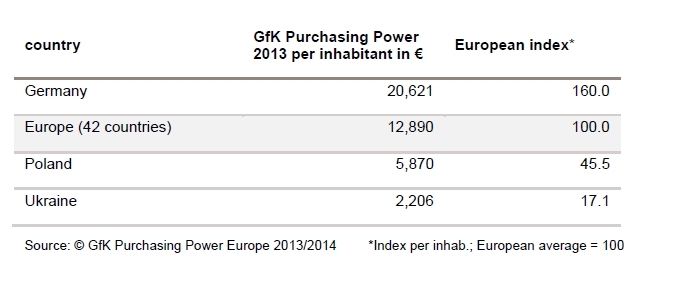
With a per-capita purchasing power of €5,870, Poland ranks 28th in Europe and as such continues to be in the bottom third of the rankings: Inhabitants of Poland have on average around half of the average European purchas-ing power per person (€12,890). As such, Poles have double the purchas-ing power available to inhabitants of Bulgaria (€2,919 per person).
Poland and its neighboring countries are prime examples of the purchasing power divide in Europe: While inhabitants in neighboring Germany have more than €20,621 available annually, Ukrainians have only one-tenth of this amount (€2,206 annually).
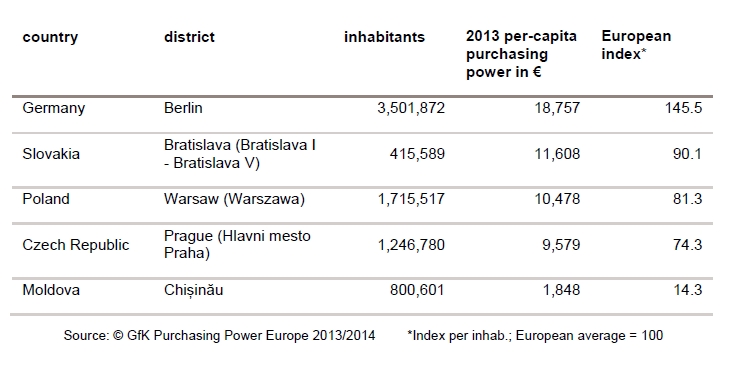
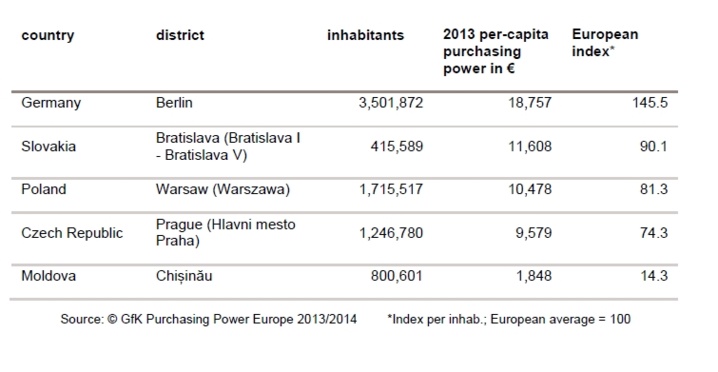
Warsaw is Poland's most populated district. With €10,478, inhabitants of this district also have the country's highest purchasing power. Wrocław, Poland's fourth largest city, has a per-capita purchasing power of €7,929, placing it in sixth place in Poland and ahead of Poznań, which ranks 12th with a purchasing power of €7,431. Poland's most affluent districts include the capital Warsaw as well as the surrounding suburbs (Piaseczyński, Pruszkowski, Warszawski Zachodni and Grodziski).
The purchasing power spread in Poland is especially large. In the Czech Republic, the purchasing power in the capital region Hlavni mesto Praha is already approximately 30 percent higher than the national average, but the capital of Poland is set even further apart from the other regions of the country: Warsaw's per-capita purchasing power is 78.5 percent above the national average and 112.5 index points higher than Przemyski, the Polish region with the lowest purchasing power (national index: 66). Norway’s capital Oslo has only 11 percent more purchasing power than the national average.
Western and Southern Europe from Portugal's perspective
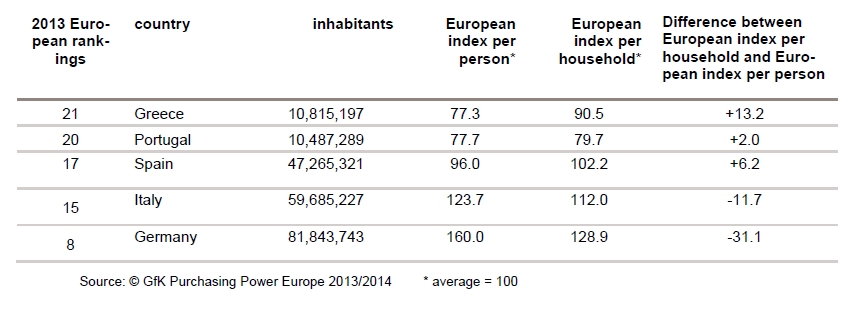
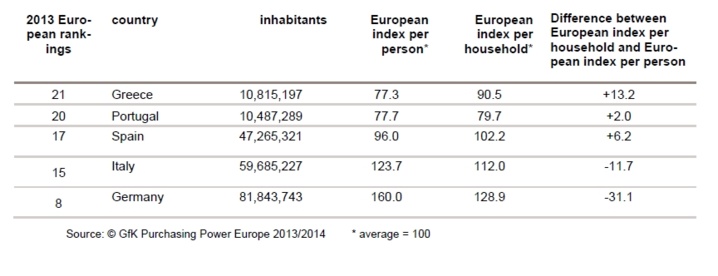
With a purchasing power of €10,018 per person, Portugal ranks 20th in Europe, behind neighboring Spain (ranked 17th) and the Mediterranean countries Malta (ranked 19th), Cyprus (ranked 18th) and Italy (ranked 15th). Compared to the previous year, Portugal has a higher per-capita purchasing power than Greece, moving it one place higher in the European rankings. Even so, the total purchasing power of Greece's 10.8 million in-habitants is still slightly more that of the 10.5 million Portuguese. This is due to the fact that in some southern European countries, the purchasing power per person is not as revealing a figure as the purchasing power per household. The latter is much higher in Greece than in Portugal, as the average household size is Greece is larger than in Portugal.
There is a wide range in Portugal's purchasing power levels. Inhabitants of the district (Distrito) of Lisbon have an average purchasing power of €14,145. This equates to a national index of 141.2, which is higher than the European average. By contrast, inhabitants of Ilha do Corvo, a part of the Azores archipelago, have an average per-capita purchasing power of just €6,443 (national index: 64.3). This corresponds to just half of the average European purchasing power.
Purchasing power varies starkly across regions of Ireland and Greece as well, two countries also hard hit by the economic crisis. In Greece, inhabit-ants of the regional unit with the most purchasing power (North Athens) have an average per-capita purchasing power of €13,805. This is more than twice the sum available to inhabitants of the regional unit of Elis in the northwest of the Peloponnese region. There is around a 47 percent spread in Ireland between the purchasing power in County Dun Laoghaire-Rathdown south of the capital of Dublin and County Donegal in the north.
Southern Europe from Serbia's perspective
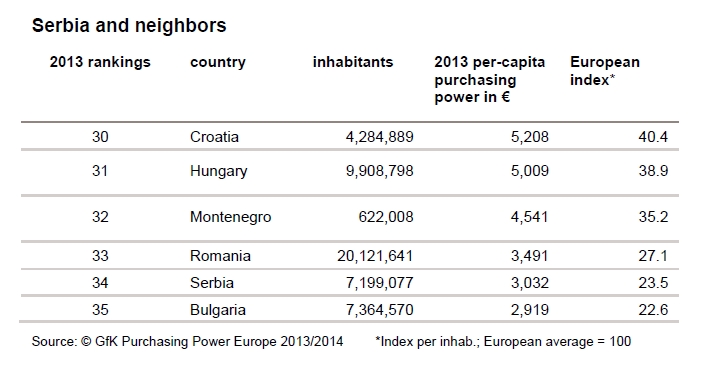
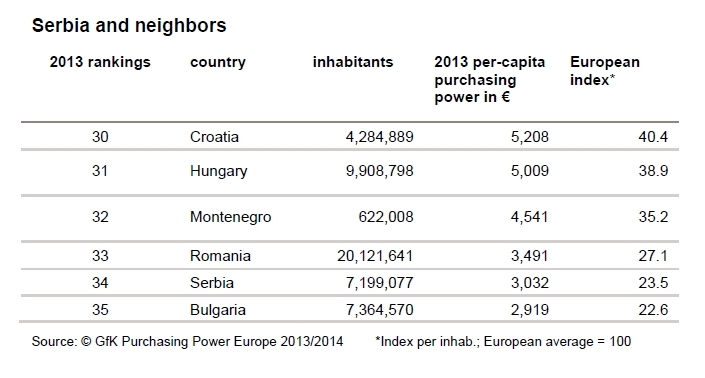
Serbia's approximately 7.2 million inhabitants have a purchasing power of just under €22 billion. With a 2013 GfK Purchasing Power of €3,032 per person, Serbia falls significantly below the European average of €12,890. As an EU candidate country, Serbia's economic development is of particu-lar interest. The increase in foreign investors in Serbia demonstrates this country's potential, although it remains at spot 34 in this year's purchasing power rankings.
GfK Purchasing Power levels in Serbia's neighboring countries are hetero-geneous: Countries that are already EU members - Romania, Hungary, Croatia - have higher purchasing power. The exception is Bulgaria, which has a purchasing power of €2,919.
Montenegro, also an EU candidate country, has a purchasing power that is almost 50 percent higher than Serbia. Macedonia, another EU candidate country in the region, has a purchasing power of €2,714, placing it four spots behind Serbia. Inhabitants of the other EU candidate countries of Albania, Bosnia and Herzegovina and Kosovo have significantly less pur-chasing power.
About the study
Purchasing power is a measure of per-capita disposable income (including any received state benefits) after the deduction of taxes and charitable contributions. The study indicates per-person, per-year purchasing power levels in euros and as an index value. GfK purchasing power figures reflect the nominal disposable income, meaning that the values have not been adjusted for inflation. The study draws on statistics on income and tax lev-els, government benefits and forecasts by economic institutes.
GfK purchasing power is used by the population for consumer purchases as well as recurring monthly expenses such as rent, energy costs, contribu-tions to private retirement funds and insurance policies as well as other expenses such as traveling and transportation costs.
The GfK Purchasing Power Europe study is calculated annually for 42 Eu-ropean countries, providing comprehensive coverage down to the level of municipalities and postcodes. The 2013/2014 study also includes data on inhabitants and households and is available immediately via GfK’s geomar-keting solution area. GfK also offers seamlessly fitting digital maps for all of Europe.
Internationally active companies need accurate predictions of the amount of money available to consumers in their markets. GfK Purchasing Power Europe provides this information and supports expansion planning, branch network optimization and controlling.
Additional information on GfK Purchasing Power Europe can be found at gfk.com/marketdata
Autres articles
-
Coinbase et Visa, un partenariat pour des transferts en temps réel
-
Brilliantcrypto, la nouvelle aventure play-to-earn basée sur la blockchain Polygon, arrive sur Epic Game Store
-
Nomination | Truffle Capital promeut Alexis Le Portz en qualité de Partner
-
IPEM Paris 2024 : 5500 participants au Palais des congrès
-
Pomelo annonce une Série A à 35 millions de dollars menée par Vy Capital


